Stay Informed
Tax Facts: When it comes to property taxes, nothing is simple
As the 2025 session of the Indiana General Assembly enters its final days, the issue of property taxes is still very much up in the air.
Part of the reason for this – as Farm Bureau members know – is that property taxes are really complicated, and one of the things that makes them complicated is the farmland base formula.
The purpose of the farmland base formula is to base property tax valuations on objectively verified data, also known as fair market value, said Dr. Todd Davis, Indiana Farm Bureau’s chief economist.
“This formula was determined by a working group of agricultural economists at Purdue University and farmer stakeholder representatives,” Davis said in his latest “Ag Economy Insights,” published on INFB’s website on Feb. 27. This approach is in use in some form in 11 of the 12 states in the Midwest, he noted. He added that the formula determines the value of farmland by evaluating the cash generated by farming and the state average rental rate for farming.
One of the complications that affect how the farmland base formula works, Davis said, is rented vs. owned land.
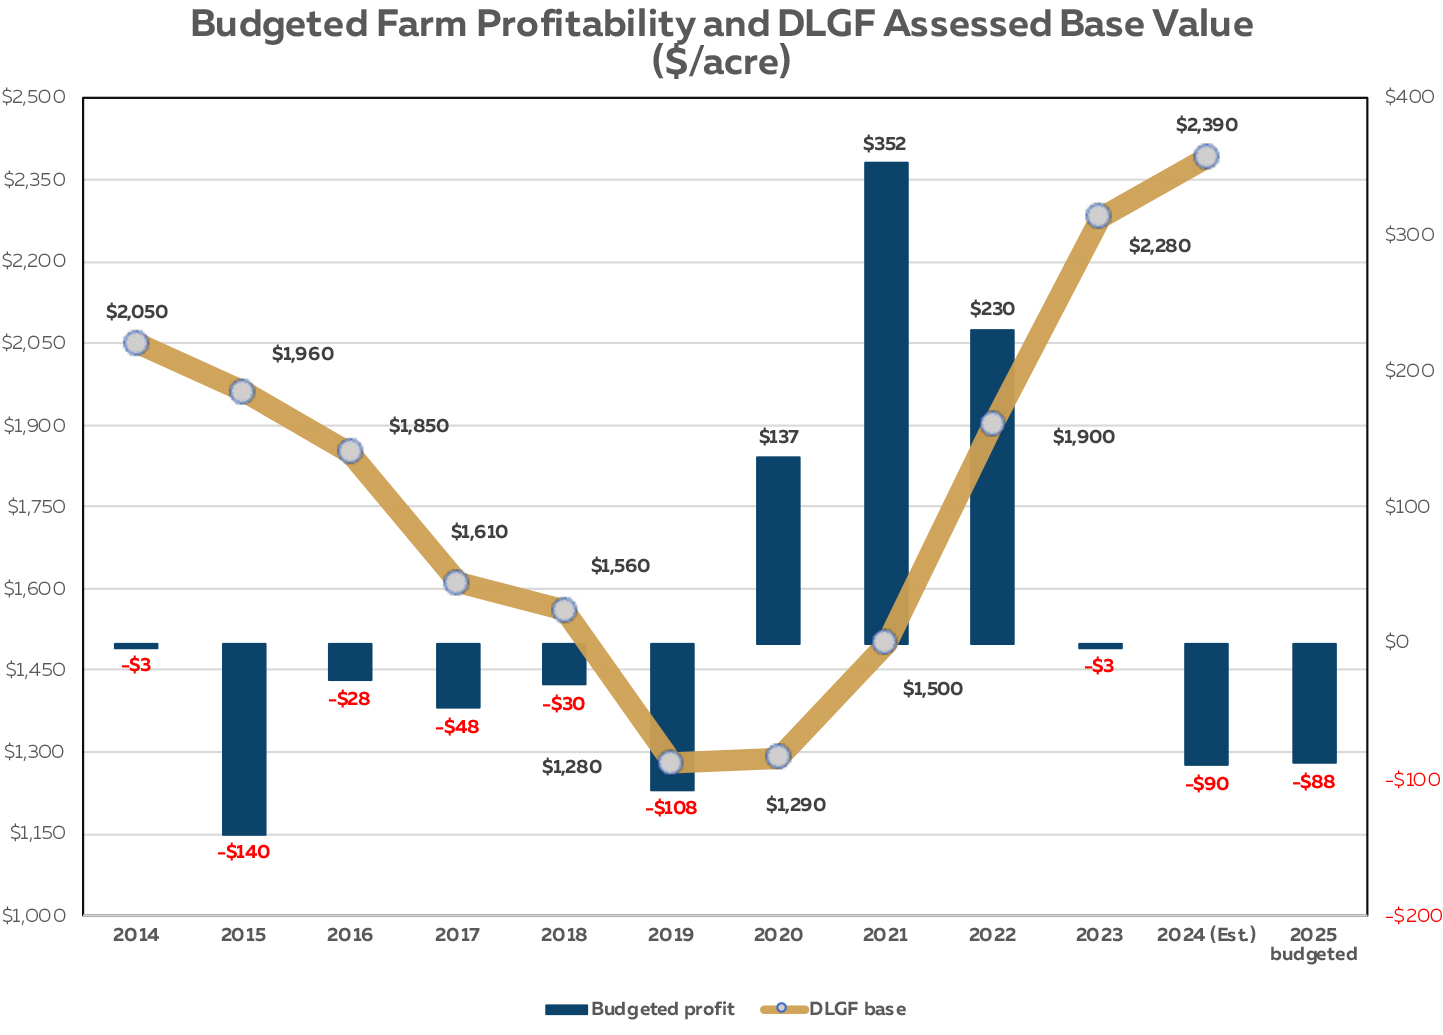
Using as an example a 1,000-acre corn-soybean farm and assuming 50% of the land base is cash rented, the Department of Local Government Finance’s (DLGF) figures showed that budgeted profitability of the owned and rented land ranged from a loss of $140 per acre in 2015 to a $352 profit per acre in 2021. In 2024 the loss per acre averaged $90.
In contrast, the return to owned in the farmland base rate formula stayed in the positive nearly every year from 2013 to 2024.
“The budgeted profitability of a farm that rents half of the land base shows declining profitability and significant variability in profits,” he said.
Other factors that affect the farmland base formula include capitalization rates and their effect on the value of an asset, as well as operating and farm real estate interest rates.
The cost of producing corn and soybeans, as well as the revenue they generate, are also important factors, he added.
Corn-soybean revenue declined from 2013 to 2019, when this revenue was about $184 an acre, or 25% less, than in 2013, Davis said. Revenues then increased from 2020 to 2022 in response to global events and transfer payments during the COVID crisis. The combination of higher global prices for commodities and government payments increased revenue by $294 an acre, or a 40% increase compared to 2013.
To date, budgeted revenue for an average Indiana corn-soybean farm is similar to what it was in 2013, at $735 an acre.
However, input costs increased dramatically in 2022 and 2023 to $164 an acre, or 42% above the production costs in 2013. These production costs are sticky and are often slow to adjust lower and are currently $149 an acre above the level in 2013, he explained.
Davis compared the DLGF’s assessed base value for farmland to the budgeted farm profitability from 2013 to 2025. He found that farm profitability from 2020 to 2022, assisted by government payments, steadily increased the base rate. In contrast, since 2022, budgeted profitability, assuming 50% of the farm is rented, has experienced steadily declining profitability.
The problem, Davis said, is the “mismatch” that occurs when farm profitability is compared to base rate value. The reason for that mismatch is the inevitable delay in obtaining the data.
“By the time the base rate value is determined the most recent data in the formula is two years old,” Davis said.
Many variations on the formula have been discussed. In 2013, the Indiana General Assembly adopted the Olympic average technique where the highest of six years was eliminated in an attempt to cut the peaks and valleys off the base rate and provide more certainty for farmers, he concluded.
INFB members and lobbyists have of course been talking about property taxes a great deal this session. Among the changes INFB has requested are increasing the maximum capitalization rate from 8% to 10% because the actual interest rates experienced by farmers are close to 8%. More generally, INFB has advocated modernizing the net income elements in the formula by removing government payments and marketing year information from the calculations.
Read Davis’ full report here.


